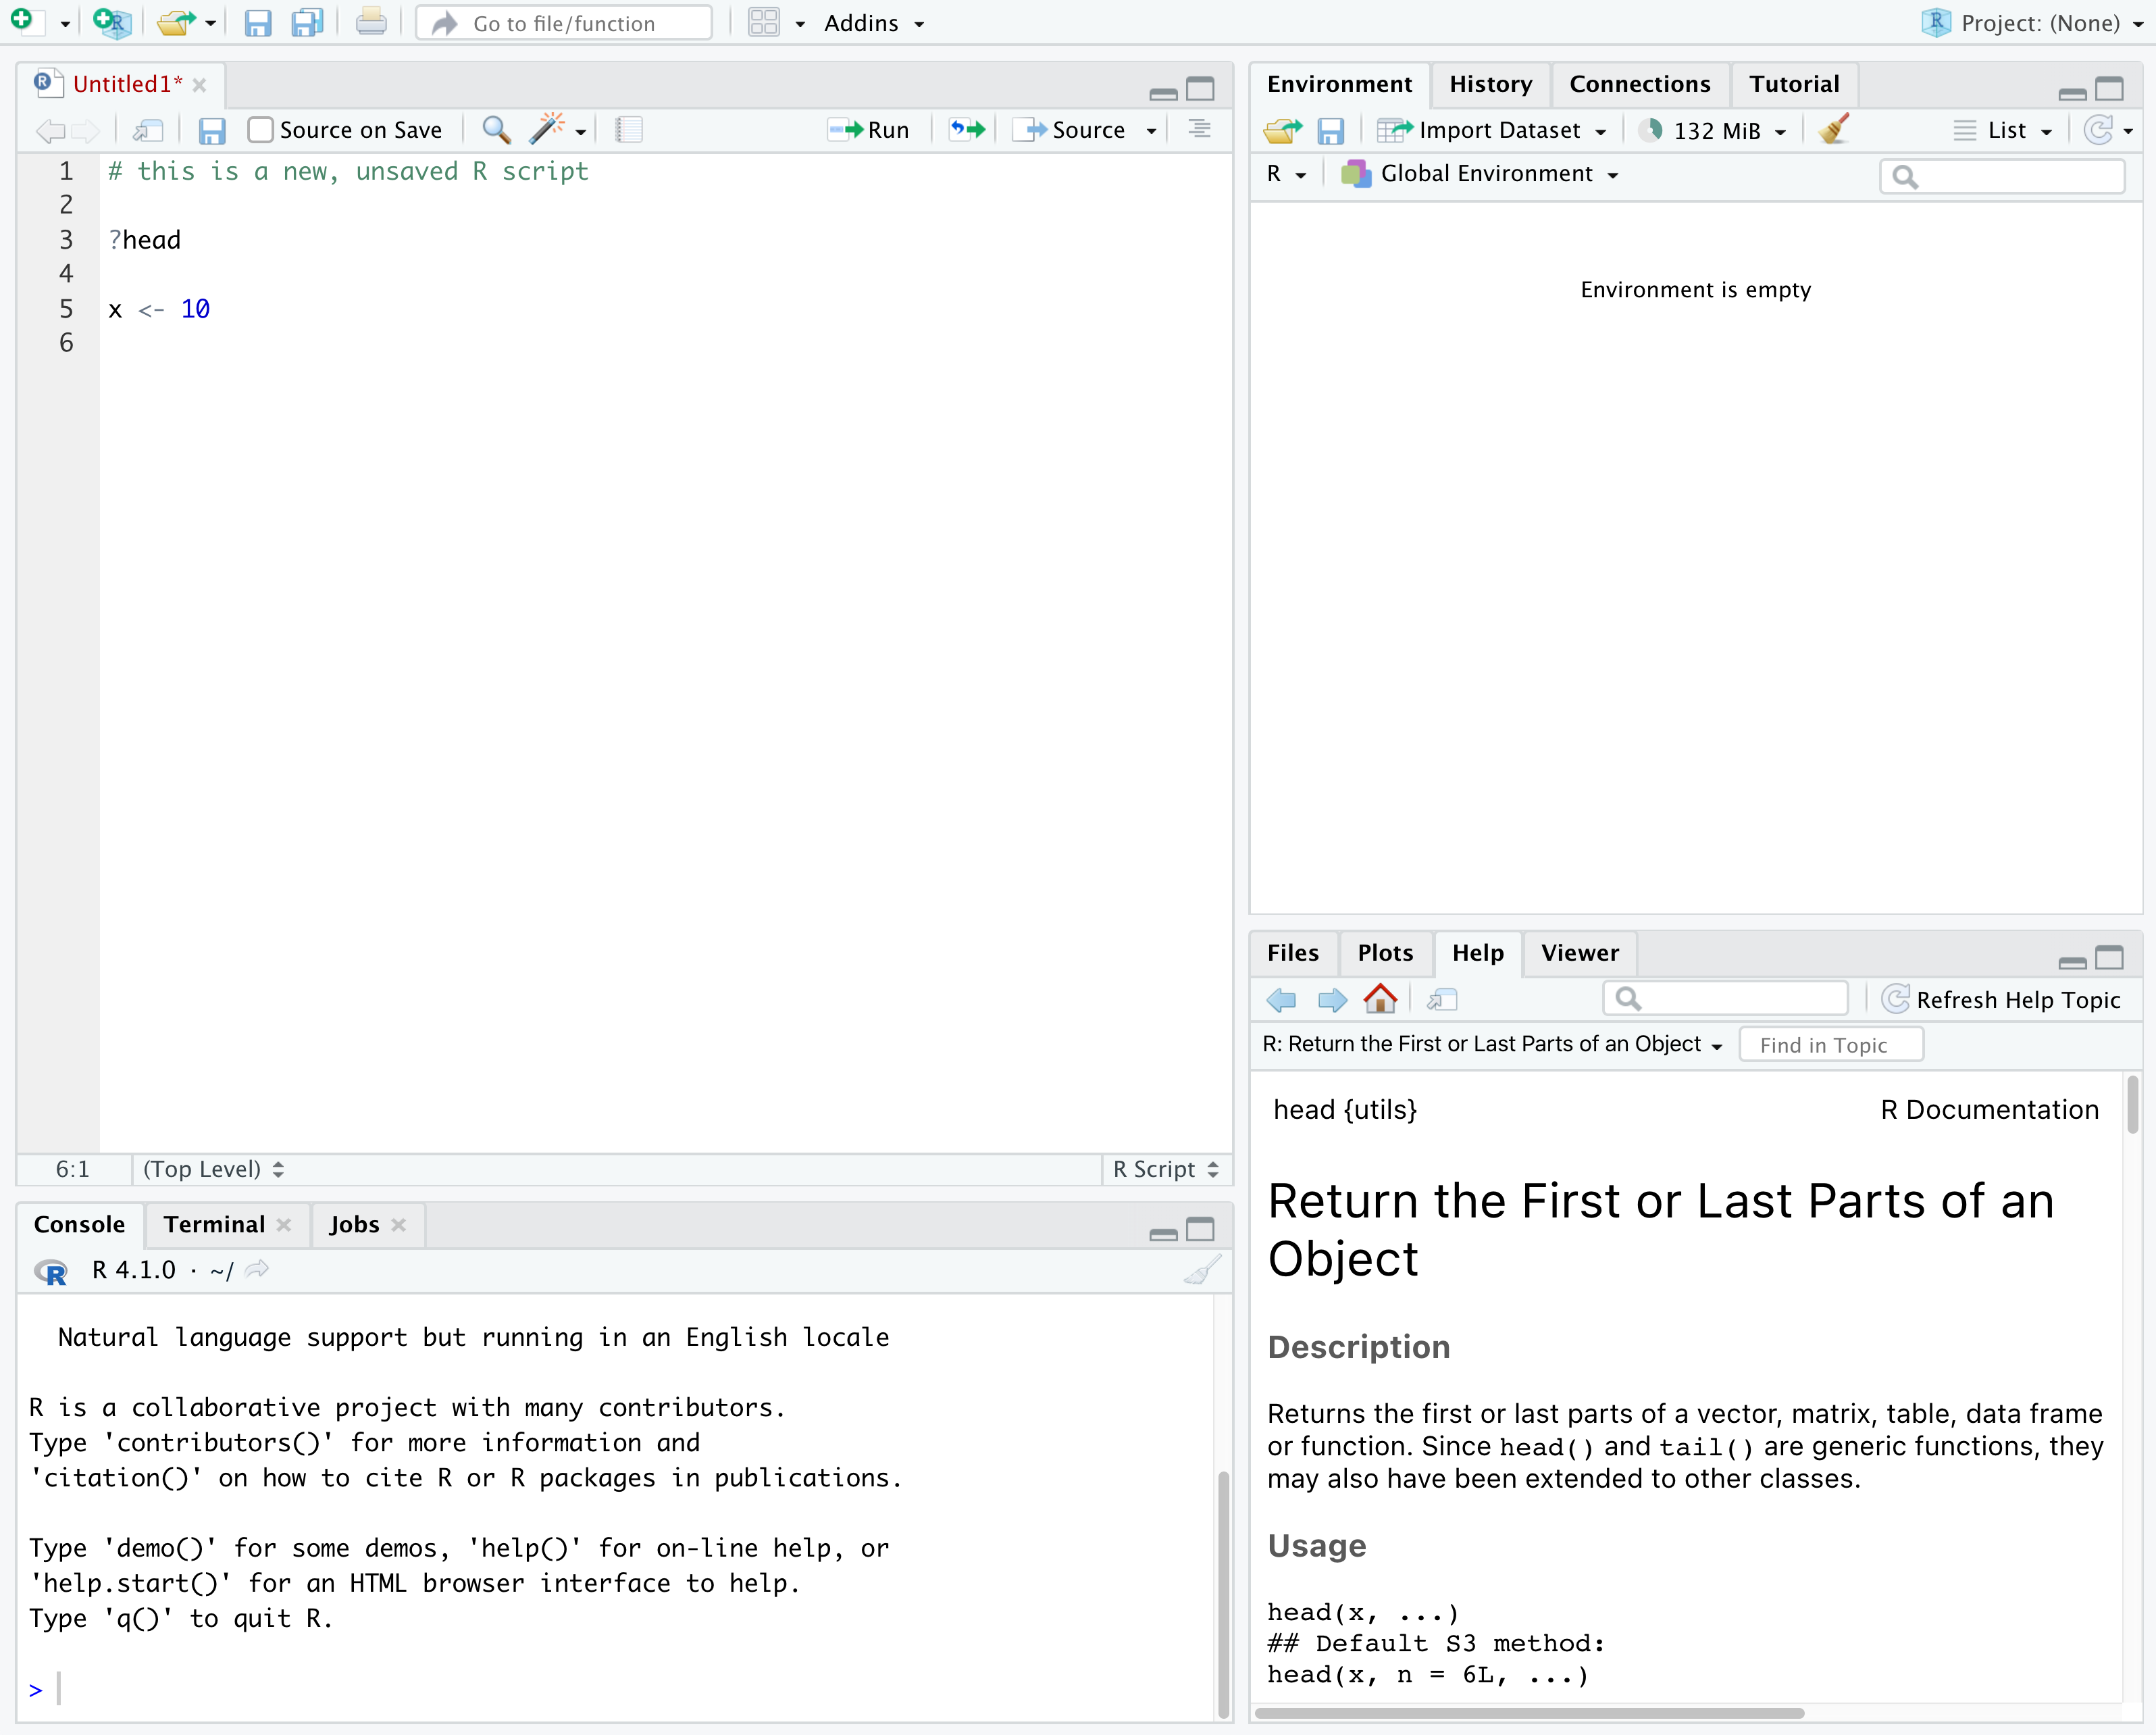
Image 1 of 1: ‘Screenshot of RStudio showing the 4 "panes".’
Figure 2
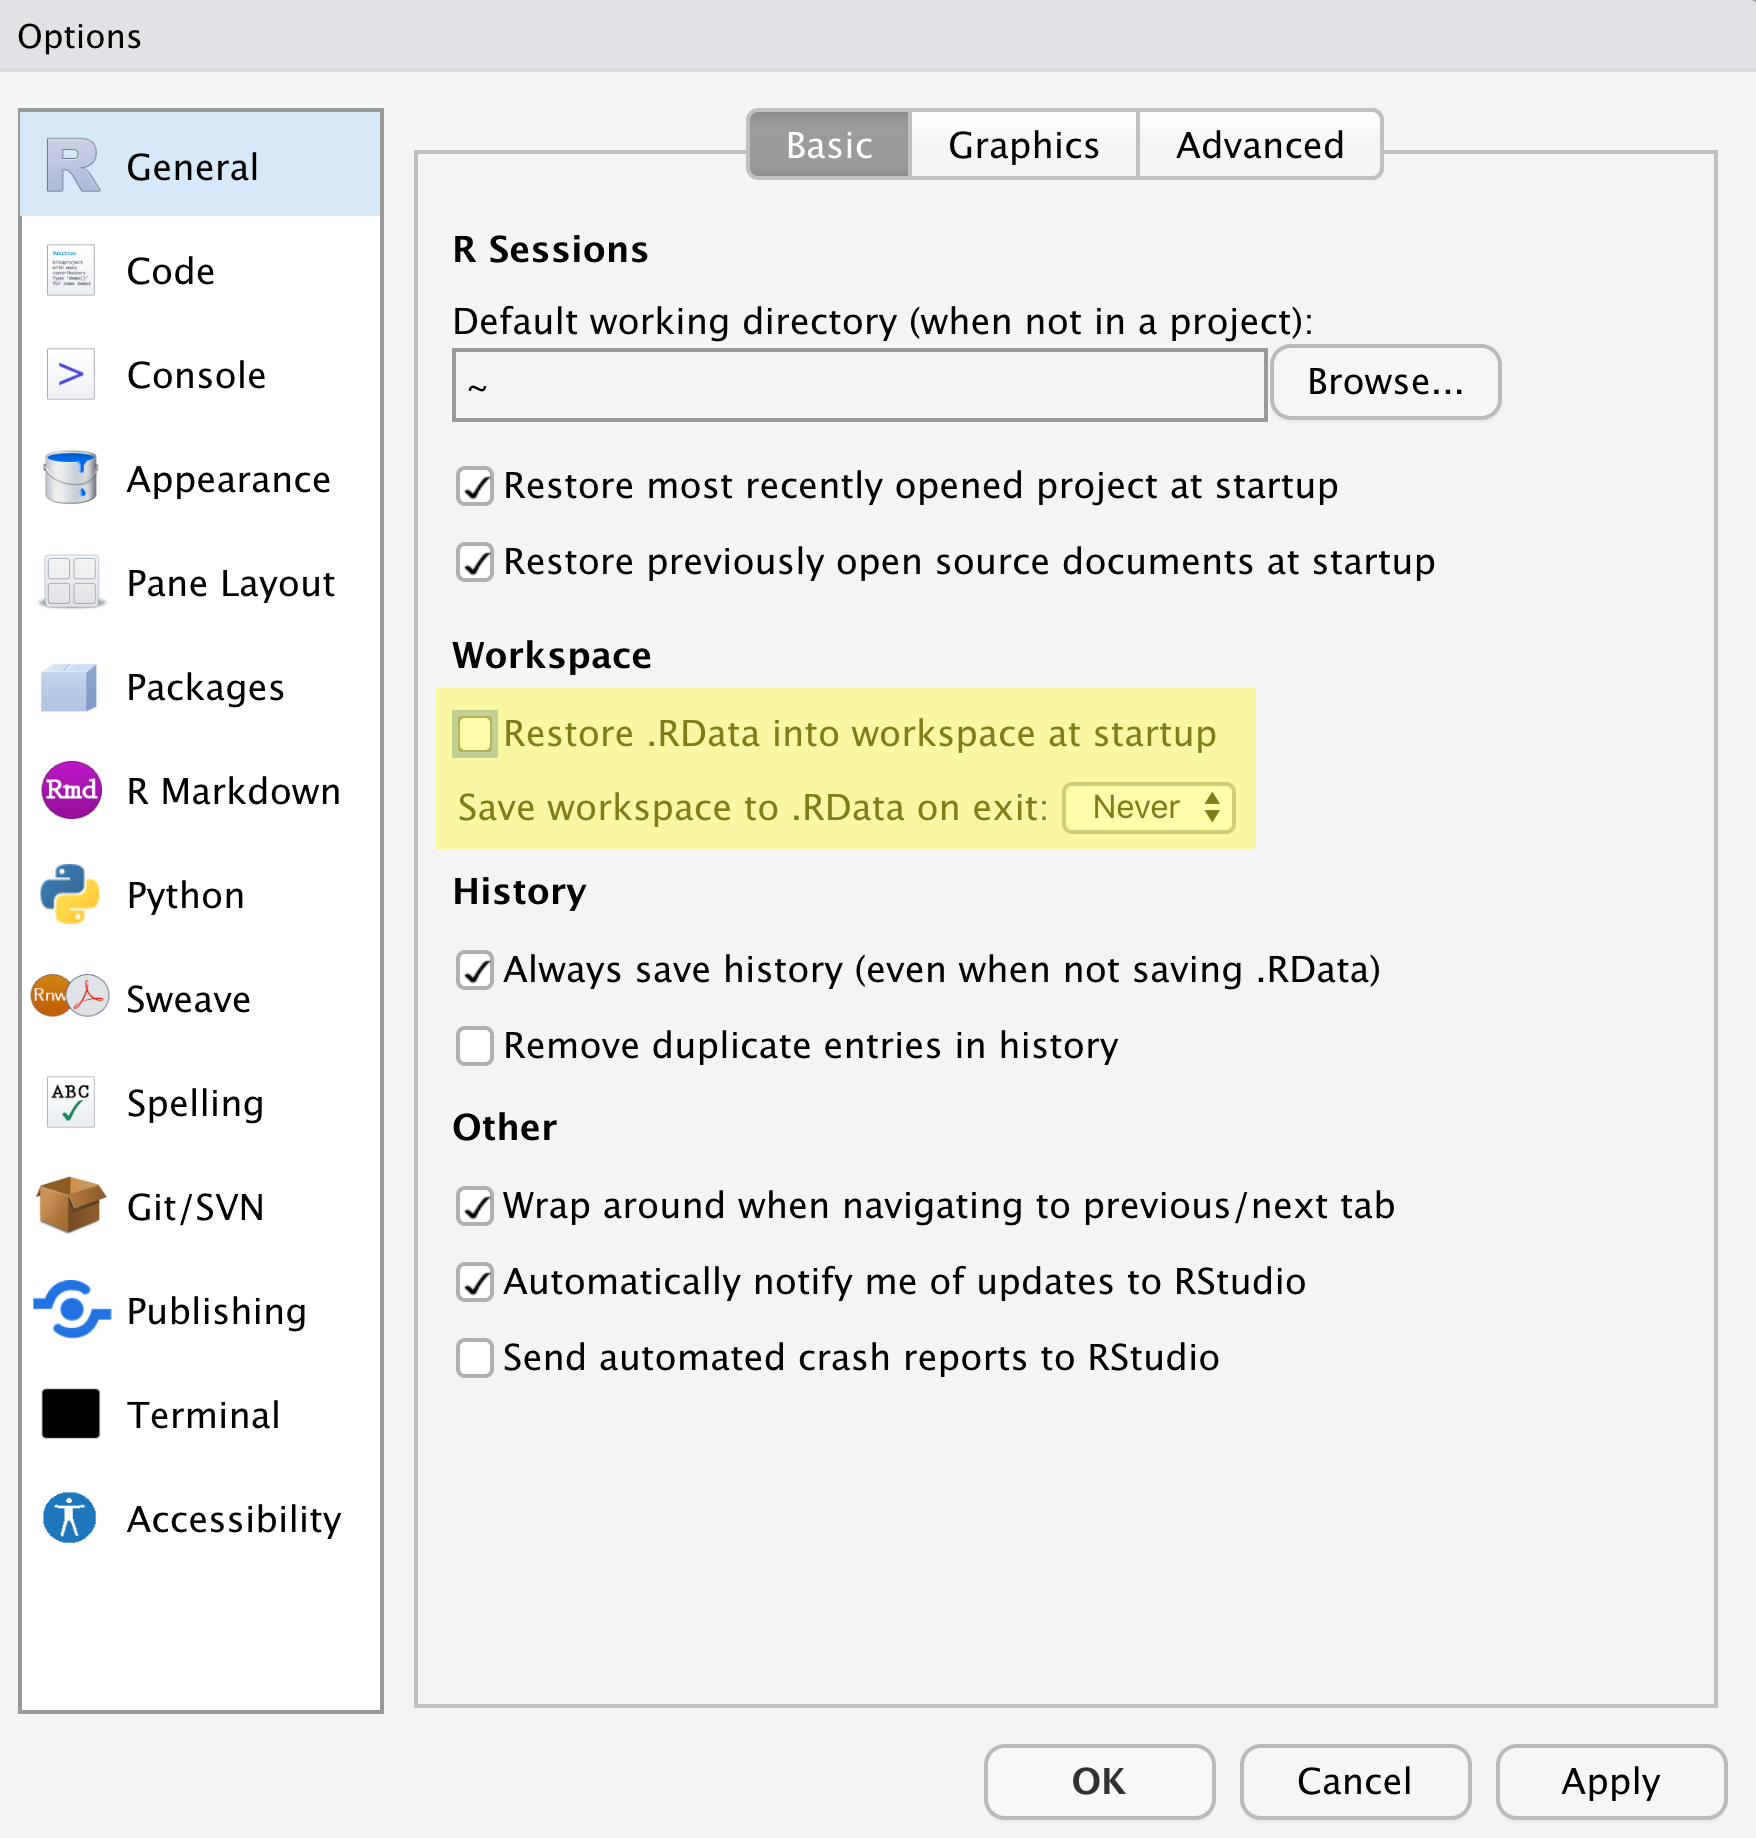
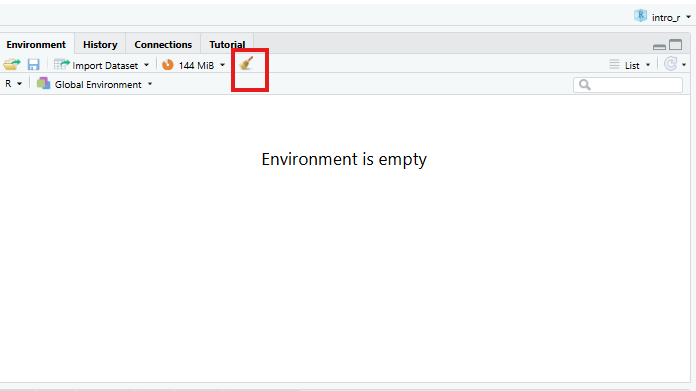
Image 1 of 1: ‘Screenshot of RStudio Global Options with Restore .RData into workspace at startup unchecked and Save workspace to .RData on exit set to Never’
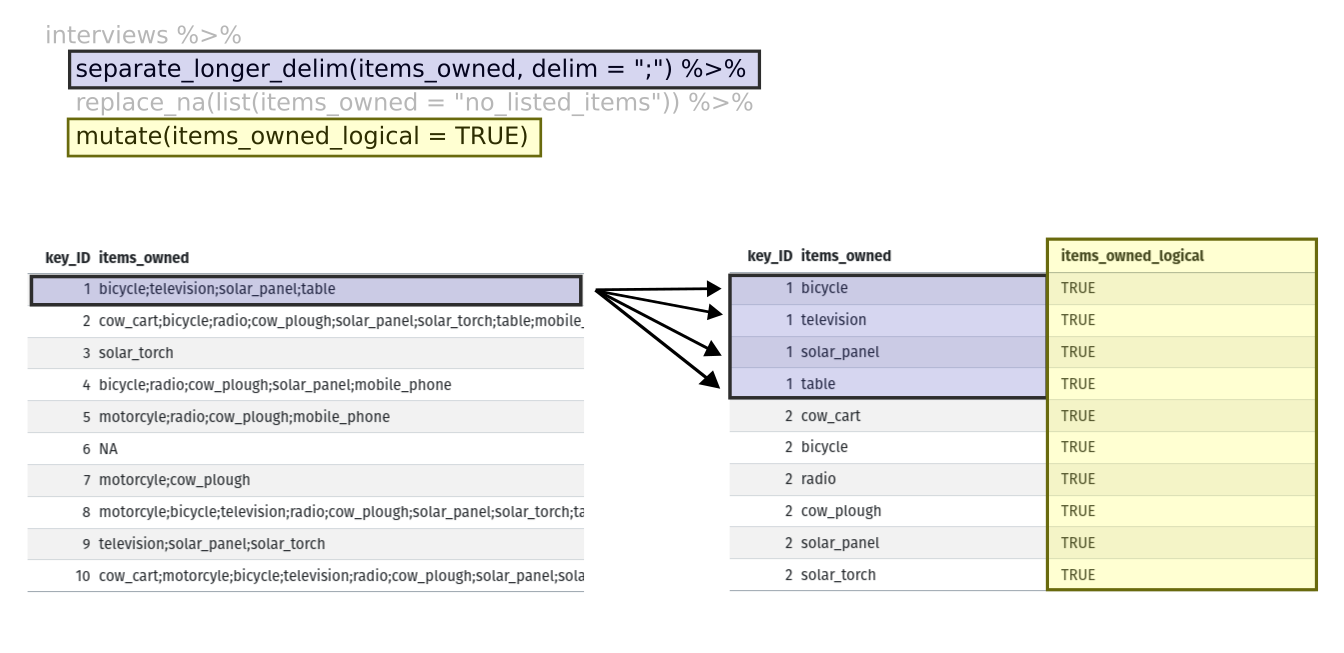
Image 1 of 1: ‘Two tables shown side-by-side. The first row of the left table is highlighted in blue, and the first four rows of the right table are also highlighted in blue to show how each of the values of 'items owned' are given their own row with the separate longer delim function. The 'items owned logical' column is highlighted in yellow on the right table to show how the mutate function adds a new column.’
Figure 5
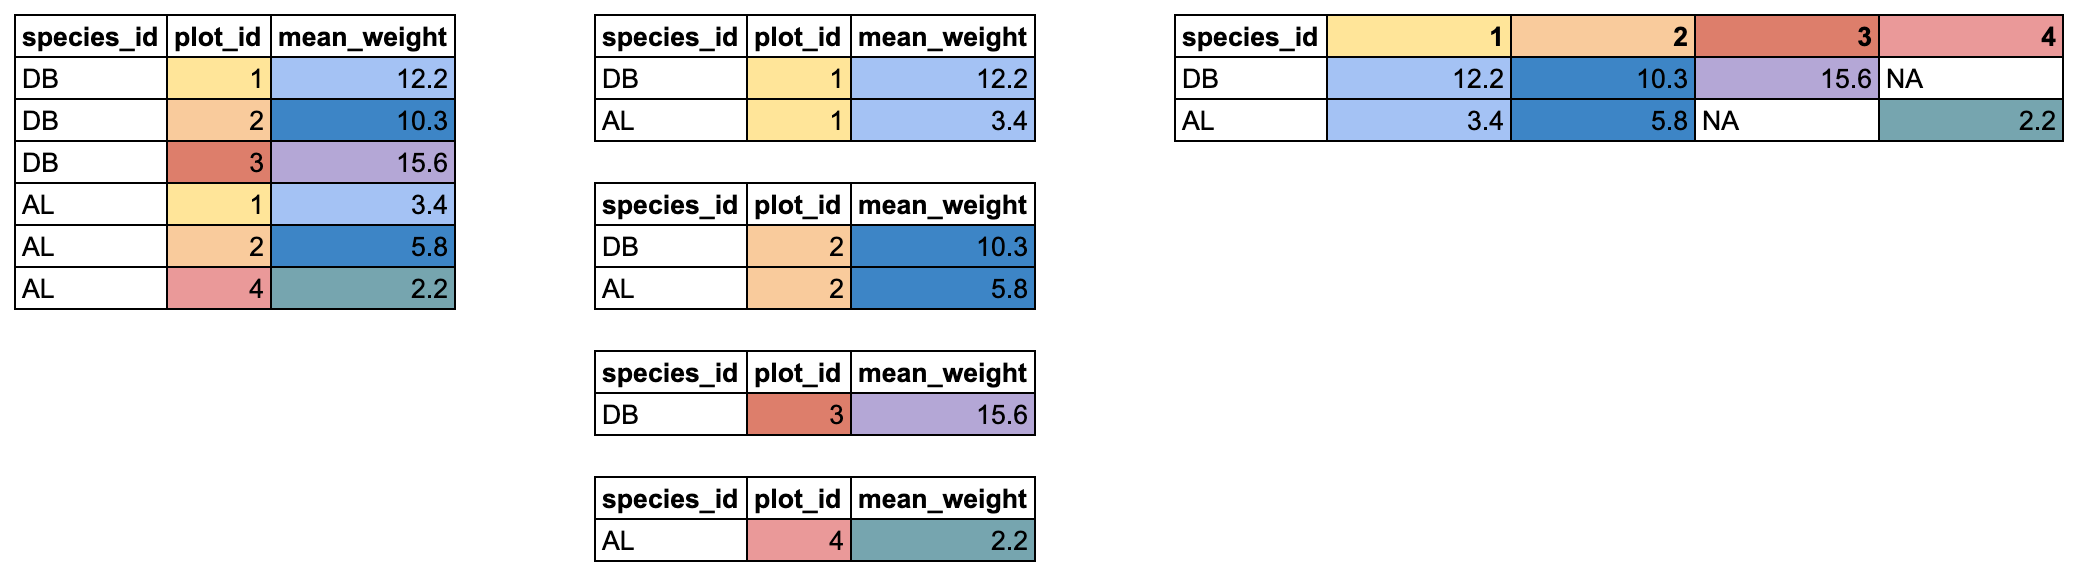
Image 1 of 1: ‘Two tables shown side-by-side. The 'items owned' column is highlighted in blue on the left table, and the column names are highlighted in blue on the right table to show how the values of the 'items owned' become the column names in the output of the pivot wider function. The 'items owned logical' column is highlighted in yellow on the left table, and the values of the bicycle, television, and solar panel columns are highlighted in yellow on the right table to show how the values of the 'items owned logical' column became the values of all three of the aforementioned columns.’

 R for Data Science,
Wickham H and Grolemund G (https://r4ds.had.co.nz/index.html) © Wickham, Grolemund
2017 This image is licenced under Attribution-NonCommercial-NoDerivs 3.0
United States (CC-BY-NC-ND 3.0 US)
R for Data Science,
Wickham H and Grolemund G (https://r4ds.had.co.nz/index.html) © Wickham, Grolemund
2017 This image is licenced under Attribution-NonCommercial-NoDerivs 3.0
United States (CC-BY-NC-ND 3.0 US)